
Industry: Education/Health
Buildings: 80
Campuses: 3
Location: S.F. Bay Area
Daily Occupancy: 22,700
Square feet: ~5M
The Client had set goals of achieving carbon neutrality by 2025 and zero waste by 2020, which is the focus of this study. To help reach its zero waste goal, the Client partnered with Zabble Inc in a pilot project.
Pilot
The six month pilot program deployed Zabble’s digital platform, Zabble Zero, across ten buildings owned and operated by the Client. The pilot’s purpose was to:
- Gain visibility into waste streams, generation and disposal patterns per building.
- Leverage data gathered to create effective programs to inform occupants.
- Track overall progress to zero waste.
For the pilot, the Client sought a return on investment (ROI) within 1 fiscal year.
Zero Waste Goal
The Client’s zero waste goal is to reach a 90% diversion rate by 2020. A recent waste audit revealed that 80-90% of the trash volume on the Client’s campuses could have been recycled or composted.
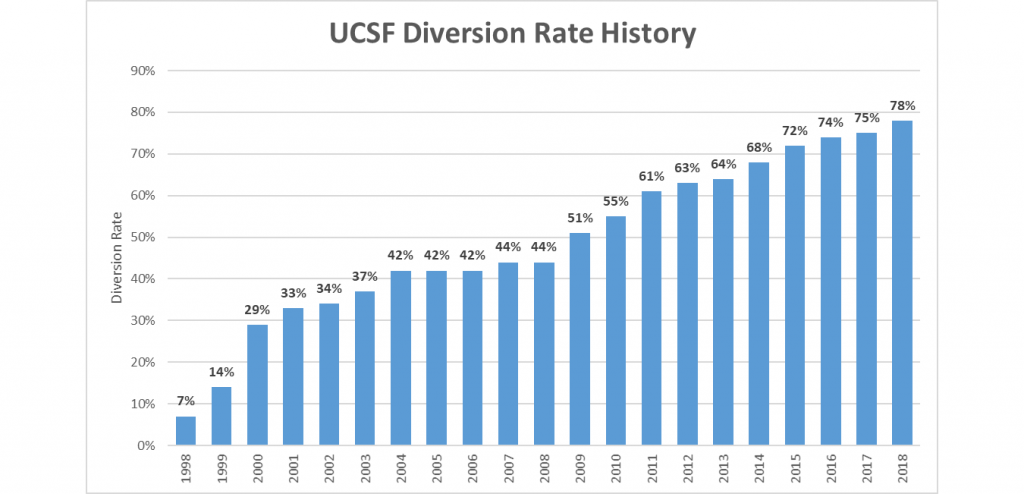
In 2018, the Client had an overall 78% diversion rate, not including construction, demolition or hazardous waste.
“[We are] 12% away from reaching the Zero Waste Goal, this is the most challenging stretch as we’ve already made the easy gains.“
Recycling & Waste Reduction Manager with the Client
Problem Assessment
The Client’s facilities team experienced several waste management issues that were consuming staff hours, adding extra costs and limiting their ability to tackle contamination or increase diversion rates. These issues were largely caused by the inadequate waste stream and operations data.
As a large institution with multiple buildings, the Client had difficulty tracking their waste stream and aggregating data across their portfolio. With many building sizes and types, determining appropriate service levels was a challenge.
1. Right Sizing: This led to either under or oversizing service levels, with negative consequences arising in both cases: when oversized, the Client would pay up to 30% more for unnecessary pickups; when undersized, they would be fined for contamination, extra pick-ups, and blockages. Without measurement data, the supervisors didn’t know what they were actually paying for.
2. Inadequate Hauler Invoices: Hauler invoices were one source of waste data available to the Client, and offered incomplete and non-standardized details that were hard to aggregate since each hauler has their own billing cycle and invoice format. Additionally, supervisors were losing about 4 hours per month inputting and analyzing their invoices.
3. Non-Specific and Inefficient Audits: Likewise, without being able to see specific generation and contamination data, facility managers were left blind to persistent problems and limited to taking broad, imprecise actions. Another source of data was available in waste audits, which were carried out using a pen and paper to record data in the field, and later transcribed into a spreadsheet. This approach is error-prone, time-intensive and fails to provide actionable insights via spreadsheet.
It took staff 66 hours per month in administrative work translating handwritten data into spreadsheet.
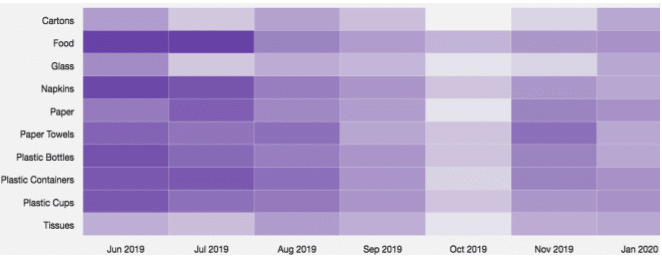
4. Limited Analytics: Furthermore, the data organization didn’t lend itself to downstream analytics in waste levels and contamination items across time, location or seasonality. It effectively negated the ability for managers to make timely adjustments, identify persistent problems or track progress towards goals. It took 3 hours per supervisor per month to analyze this information.
5. Missed Pickups: Missed pick-ups by the waste hauler were another issue vexing the Client’s staff, occurring 3-4 times per week per building across all streams on average. This created overflowing dumpsters, rodent and odor issues that led to staff having to consolidate the waste with that of other buildings. Staff was spending 11 hours per month to fix the situation by hand, while supervisors lost one hour per month getting the waste hauler to return, which would take at least a full day.
Zabble Zero
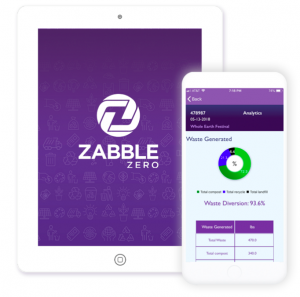
The Platform For Zero Waste Intelligence
Equipped with Zabble Zero, the Client gained accurate data collection, transparency into their waste stream, and precise contextual analytics in real-time to inform their actions.
1. Digital Tagging: The mobile app-enabled staff to tap, swipe and easily document circumstances on the ground during their inspections, which was then immediately uploaded to the cloud and visible for supervisors to access in real-time.
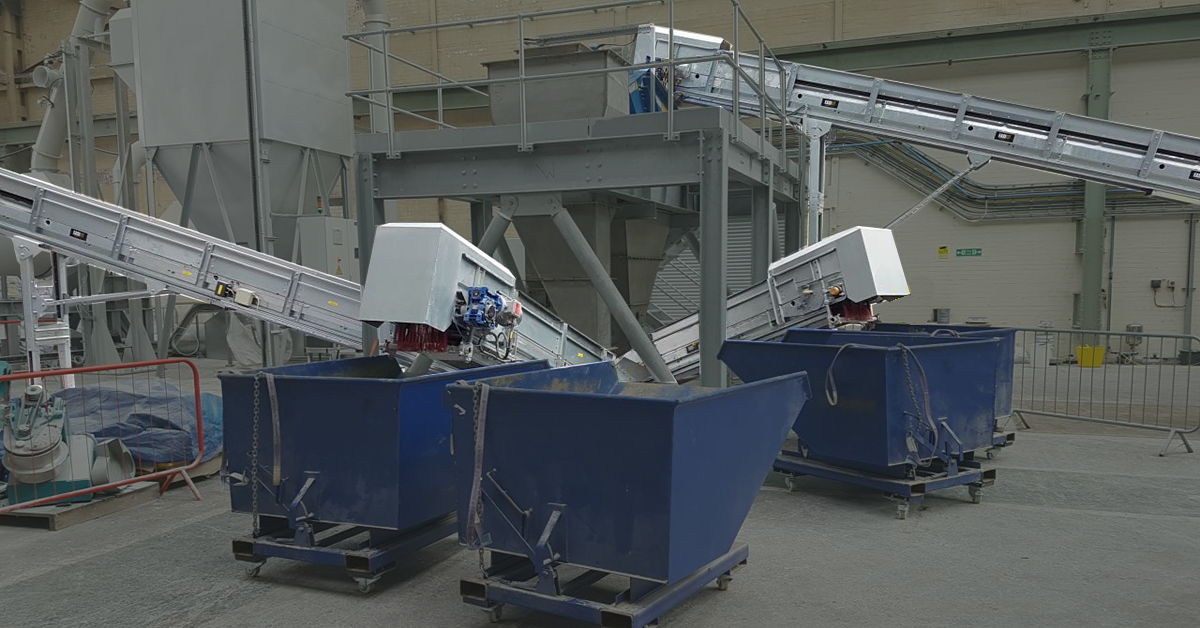
The app was used for 2 primary purposes: (1) To monitor contamination from occupants or janitorial operations, staff would open every 10th bag coming into the loading dock and snap a photo, tag fullness and contamination levels with a swipe, and enter acceptable or unacceptable materials with a single tap. (2) To monitor carts, roll-offs and compactors that would be picked up by the hauler, staff would snap pictures of the containers and tag fullness and contamination levels and the items that were incorrectly disposed of in them.
2. Optimum Service Levels: With reliable invoice analysis and measuring quantities of waste being generated by each building, managers were able to appropriately match service levels to each building, thereby decreasing costs and headaches.
3. Instant Notifications: If staff found illegal dumping, an overflowing dumpster, hazardous materials, glass or electronic waste in a bin or notice a pickup has been missed, facility managers received an email instantly to correct the problem. This created a rapid response mechanism to head off costly fines and avoid having to dedicate hours of staff labor to redistribute material from overflowing bins.
4. Invoice Streamlining: Each month, the Zabble Zero platform automatically aggregated and analyzed the Client’s invoices across their portfolio of buildings, comparing costs, services levels and diversion metrics, highlighting the best and worst performers.
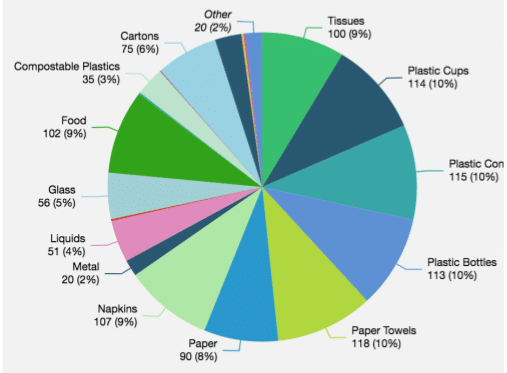
5. Precise and Actionable Insights: During the pilot, each user tagged more than 1000 items across landfill, recycle and compost streams with their estimated contribution to contamination paving the way for granular insights. These insights were then utilized to inform specific, targeted actions to fix problems, decrease contamination and boost diversion rates.
“The Zabble Platform helps analyze the data in ways we have not been able to do so, this will help us target our educational material to move us closer to the Zero Waste Goal.”
Recycling & Waste Reduction Manager with the Client
6. Targeted Education: Using a simple drag and drop feature in the Zabble Zero web platform, the Client was able to display specific waste data for a building onto a nearby screen visible to passers-by. The precision and relevance of the data created engaging, educational content that offered viewers tangible steps to reduce contamination issues in that building.
Conclusion
Zabble Zero enabled the facility and recycling team to regularly monitor waste generation, diversion, contamination and operational issues, identify areas for improvement, tackle problems right away and improve overall process efficiency.
Since the Client was already a leader in pursuing zero waste, many buildings already had very high diversion rates, typically around 90%. Going any higher was a challenge, since certain items like lab waste could only be landfilled. In spite of that, the buildings in the pilot increased their diversion to 93%, essentially hitting the maximum diversion possible. While half of the buildings in the pilot had personnel to sort for contamination and the other 5 buildings did not, both groups reduced their waste tonnage by 11% and 13%, respectively.
The greater issue for the Client was with contamination. A common goal for zero waste is to lower contamination rates below 10%. Using Zabble Zero, the Client found that the contamination of waste entering the loading dock was between 40% and 85%. During the pilot, buildings with sorters were able to see their contamination reduced to under 5% and those with sorters to less than 15%.
Using data, the Client renegotiated their contract with the waste hauler to limit the number of missed pickups to 2 per week max, versus 3-4 per week previously.
Transparency into special cases allowed recycling staff to track persistent problems and contact custodial, facility and Environmental Health & Safety stakeholders who dealt with the offending party.
Efficiency gains from digital processes paid off: instead of spending logging waste audits on paper and then transcribing them to spreadsheets, dealing with missed pickups, special contamination cases and analyzing invoices, the Client gained 77 staff and 8 supervisor hours per month for other tasks. This savings in time translated to the Client realizing an ROI within 6 months.
Using Zabble Zero, the Client established a model for a new paradigm of tracking waste generation, preventing and rapidly handling disruptive problems, harnessing data to inform targeted actions and overall developing a process to gradually move the organization closer and closer to its zero waste goal.
“This platform really has the potential to help us meet [our] Zero Waste goal by 2020.“
Recycling & Waste Reduction Manager with the Client